
LIBRARY
Figures & gallery
Explore 46 explanatory diagrams connecting SMM and DTT to records, nested time, phase, geometry, constants, and matter.
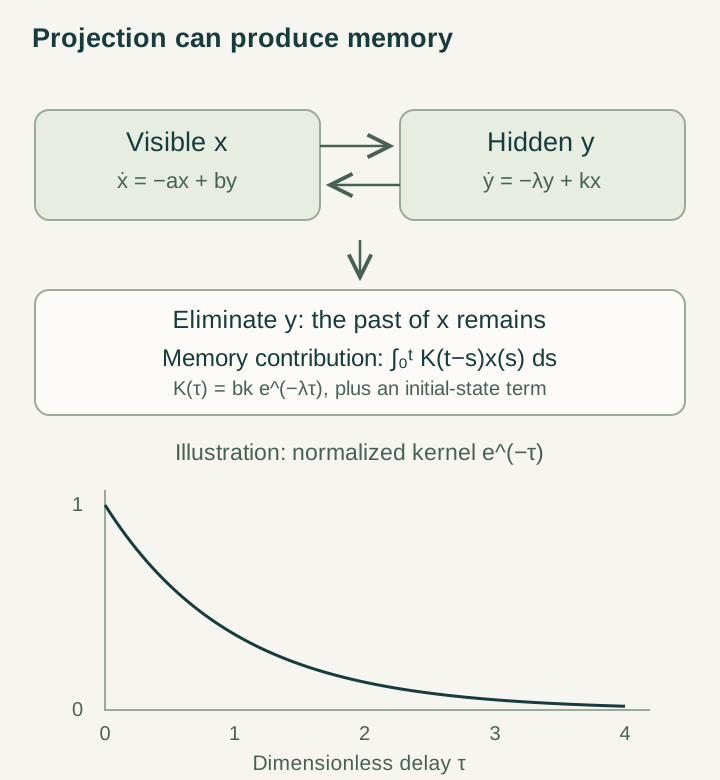
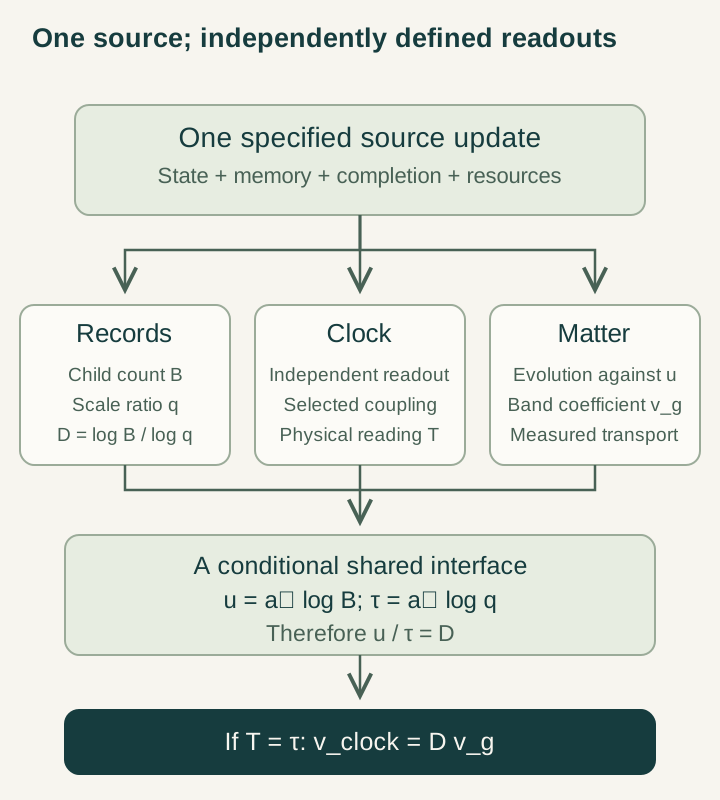
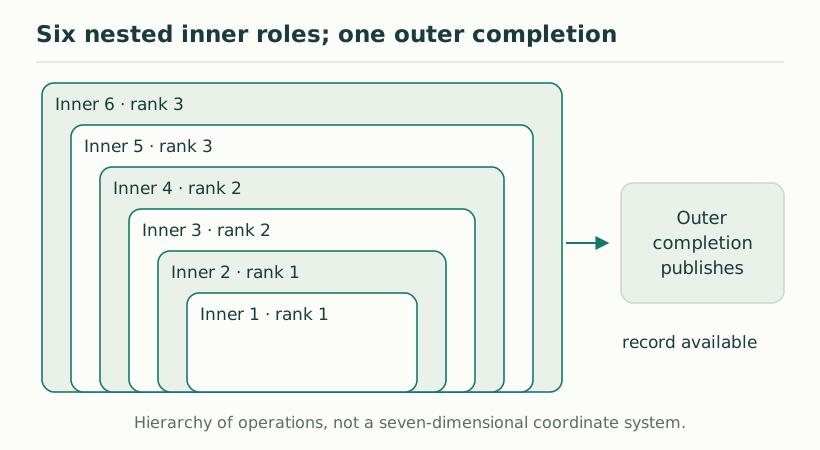
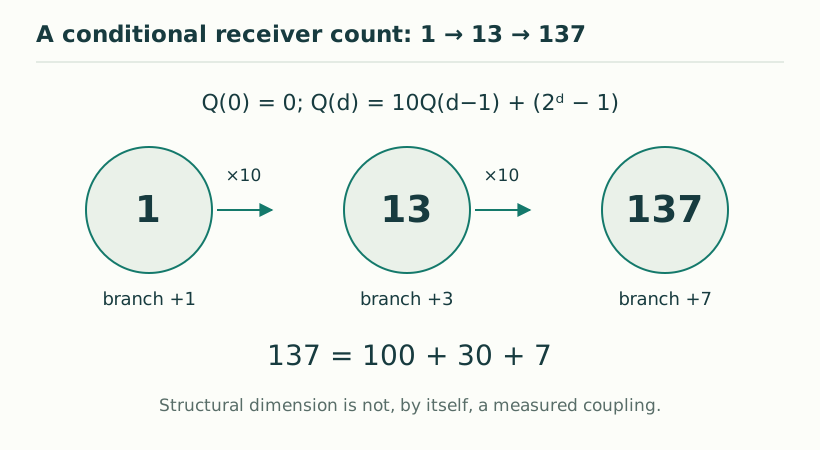
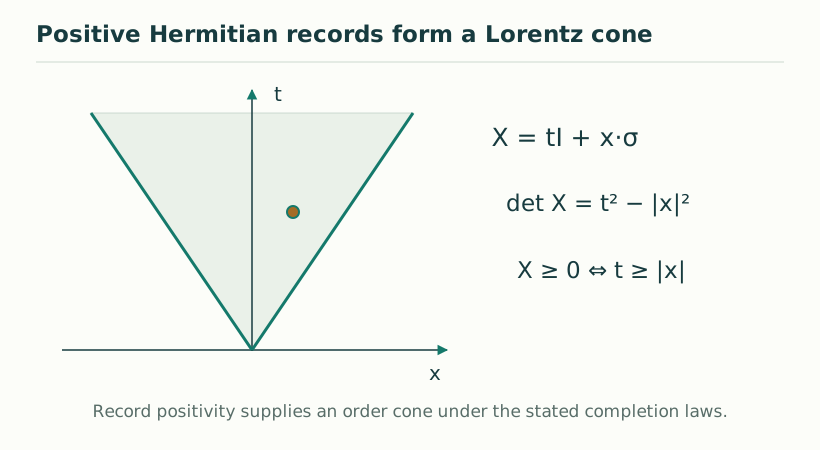
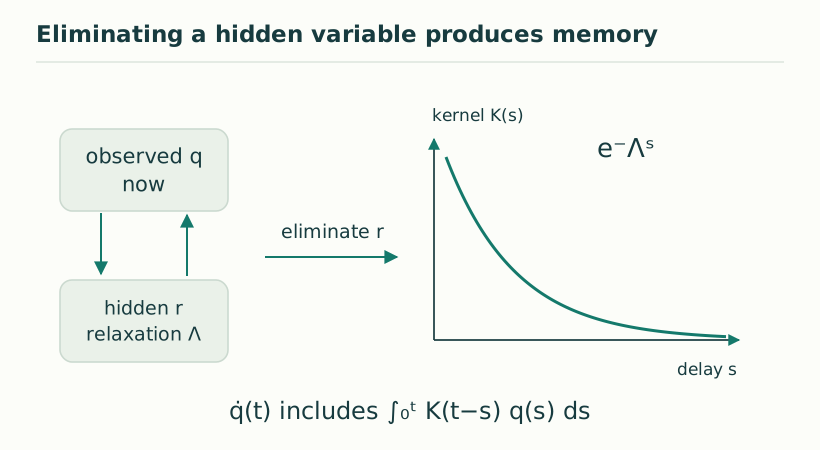
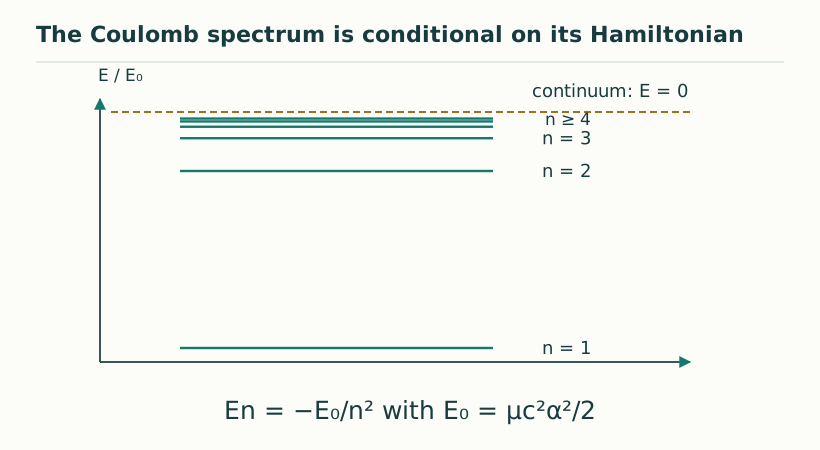
Figures in the article atlas connect generative histories with completed records, and make the mathematical steps in geometry, phase, constants and atomic models easier to follow. Their captions state whether they represent a conceptual scheme, a worked calculation or an idealized example.
Open a diagram at full size or continue into the associated article for its assumptions and derivation. The vector artwork remains sharp on small screens and when enlarged.
Six diagrams for the foundation guides
Begin the guides →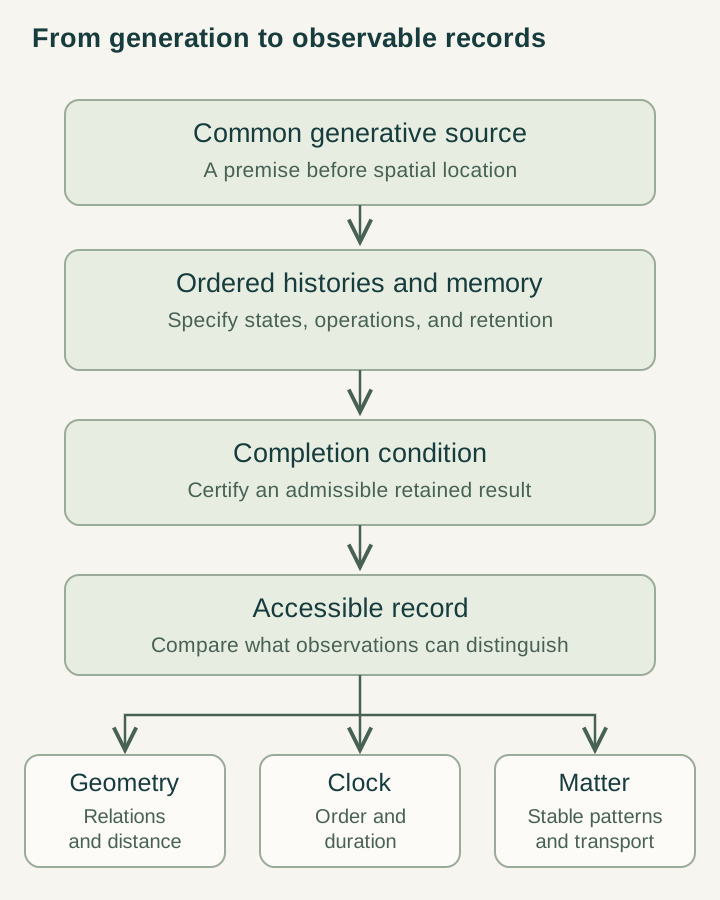
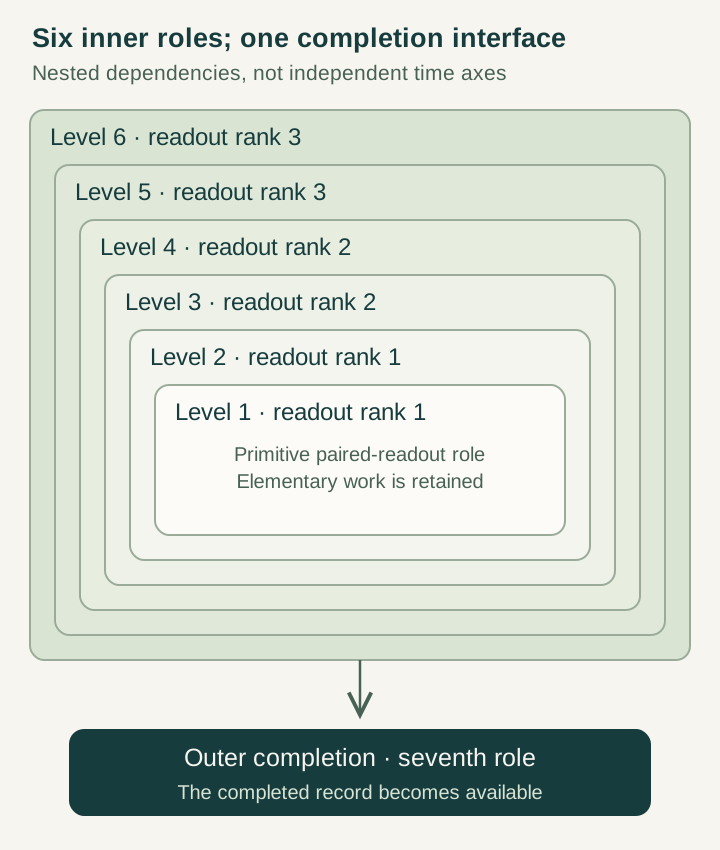
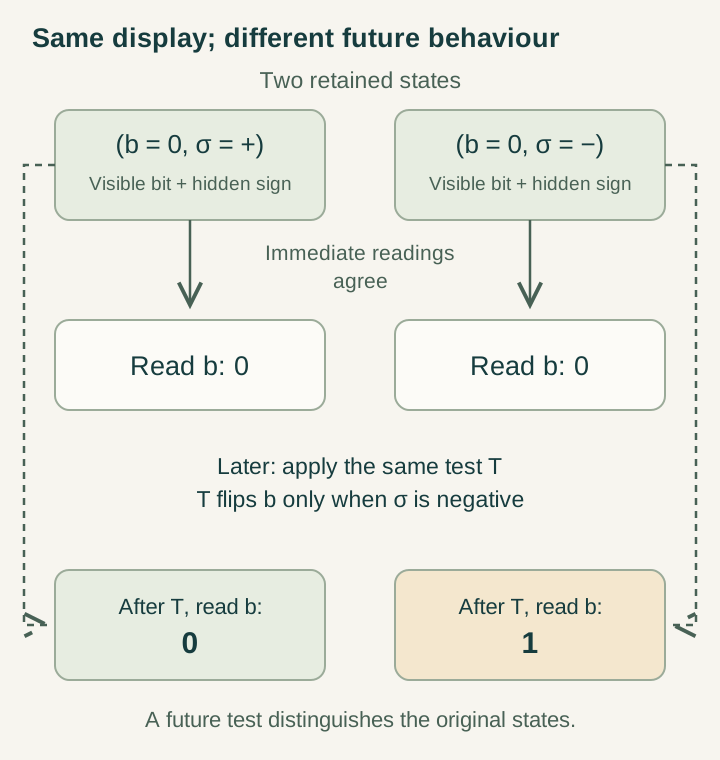
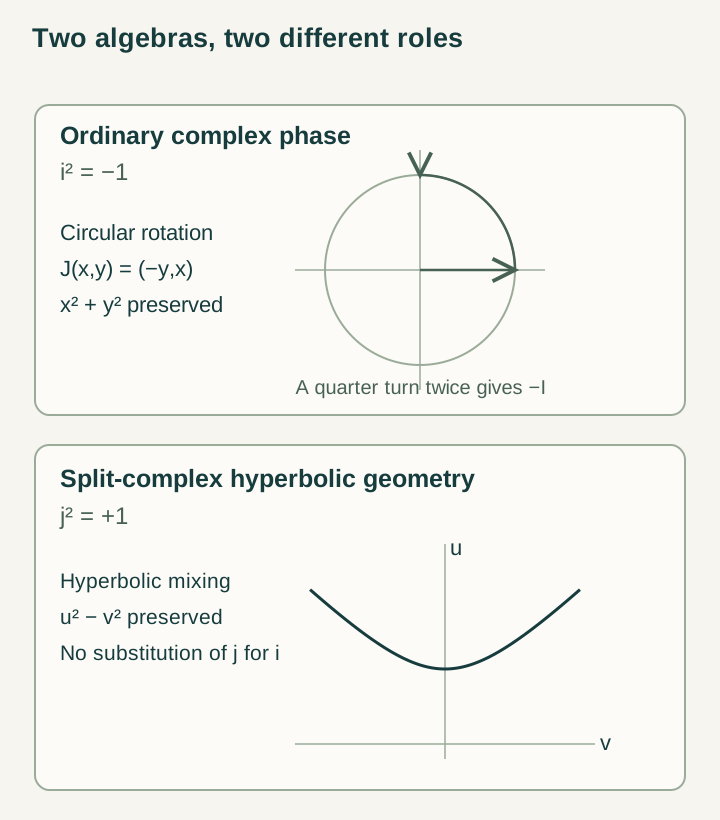
Diagrams from the atlas
All 40 figures →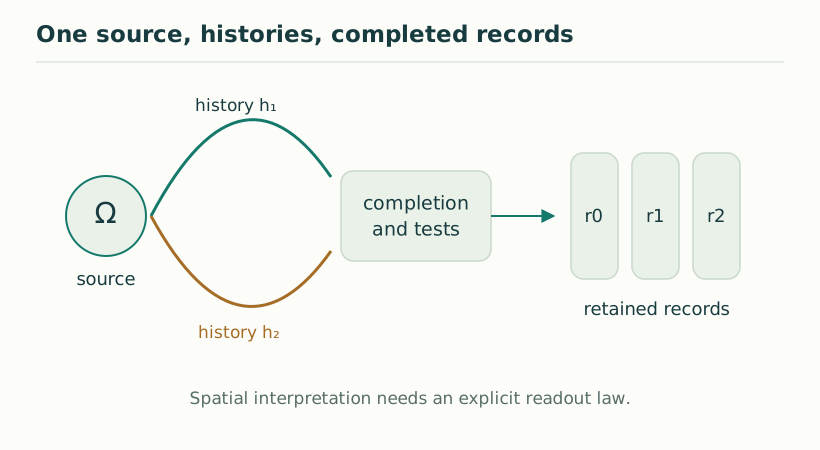
Keep following the question.
The glossary explains the vocabulary; the reading paths connect the ideas; the source register points to the original arguments.